
These calculators do arithmetic on published formulas. You put in your own measurements. Each one returns a number along with the equation it used, so you can see where the figure came from. None of them diagnose anything, and none of them replace a lab panel or a physician.
Subscribe for more
Join our newsletter to get the latest news, tips, and stories from Opt Health.
The tools
TDEE & Macro Calculator
Your resting rate, total daily energy expenditure, a calorie target, and protein, fat, and carb grams for your goal.
 Protein Intake Calculator
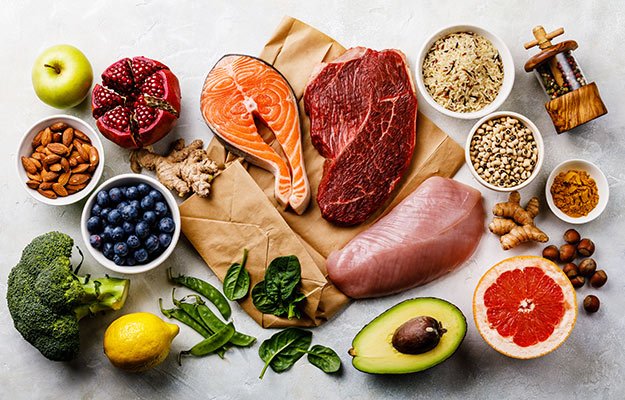
A daily protein range in grams and a per-meal split, scaled to your weight, goal, and training.
Protein Intake Calculator
A daily protein range in grams and a per-meal split, scaled to your weight, goal, and training.
 FFMI & Body Composition Calculator
Fat-free mass index, lean body mass, fat mass, and waist-to-height ratio from your body-fat percentage.
FFMI & Body Composition Calculator
Fat-free mass index, lean body mass, fat mass, and waist-to-height ratio from your body-fat percentage.
 Water Intake Calculator
A daily fluid target and the amount to actually drink, scaled to your weight, training, and climate.
Water Intake Calculator
A daily fluid target and the amount to actually drink, scaled to your weight, training, and climate.
How to use them together
The four tools answer different parts of one question, and they are more useful in sequence than in isolation.
Start with body composition. The FFMI calculator gives you a baseline that separates lean mass from fat mass. Weight alone cannot do this, and neither can BMI, which counts a pound of muscle and a pound of fat identically. Get one accurate body-fat reading, from a DEXA scan if you can, and use it as the anchor for everything that follows.
Then set the calorie target. The TDEE calculator estimates what you burn and applies a deficit or surplus as a percentage of it. Percentages scale with body size and flat numbers do not. A 300-calorie cut is a modest deficit for a 220 lb man and an aggressive one for a 160 lb man.
Set protein from your goal. The calorie total does not set it. The macro calculator picks a protein figure for you, and the protein calculator shows the full range and the meal-by-meal split. Protein requirements rise in a deficit, because the job shifts from building tissue to protecting it.3
Hydration sits underneath all of it. The water calculator scales fluid to your body size and training rather than handing you the same eight glasses everyone else gets. It also names the situations where drinking more is the wrong move.
One set of numbers through all four
Take a 45-year-old man, 5 ft 10 in, 185 lb, training four times a week, who wants to lose fat without losing muscle.
| Tool | Output | What he does with it |
|---|---|---|
| FFMI | At 18% body fat: 152 lb lean mass, FFMI 21.8, waist-to-height 0.49 | This is the baseline. Lean mass is the number that must not fall over the next 12 weeks |
| TDEE and macros | Resting rate 1,730 kcal, TDEE 2,682 kcal, target 2,146 kcal at a 20% deficit | Sets the calorie budget. He weighs in under the same conditions for three weeks before adjusting it |
| Protein | 151 to 227 g a day for a cut, near 189 g in the middle | Protein comes out of the calorie budget first, because it is what protects the lean mass in row one |
| Water | About 96 oz to drink on a training day | Sets the fluid target. A hard session or a hot week raises it |
Three weeks later the only figure he re-checks is body weight, and only as a trend. If the trend is flat at an accurately logged 2,146 kcal, the deficit estimate was wrong and the target comes down by 150 kcal. If lean mass has fallen at the next FFMI measurement while weight fell as planned, the protein target was too low or the deficit was too aggressive. That is the whole loop, and it is the reason to run the tools together rather than one at a time.
What these tools are, and what they are not
Every calculator on this page is an estimate built from population data. Three consequences follow before you act on any of the numbers.
Predictive equations carry real error. Mifflin-St Jeor predicts measured resting energy expenditure better than the alternatives, and it still lands within roughly 10 percent for most people rather than all of them.1 For a 2,000 calorie maintenance figure, 10 percent is 200 calories a day. The correct response is to use the number as a starting point and let two to three weeks of real weight data correct it.
Your inputs set the ceiling on accuracy. The FFMI calculator cannot be more accurate than the body-fat percentage you feed it, and consumer bioimpedance scales vary by several percentage points against reference methods and shift with hydration.6 Measuring under identical conditions matters more than the specific method you pick.
None of these numbers is a diagnosis. A calculator can tell you how many grams of protein fit your goal. It cannot tell you why you are tired, or why your body composition is moving the wrong way on a programme that used to work. Those questions need blood work. Those questions need blood work and a physician reading it.
Practical takeaway: use these to set a starting point and to track your own trend. When the inputs are right and the trend still will not move, the answer is upstream of the arithmetic.
Where the arithmetic stops and the panel starts
Men usually arrive at a calculator because something is not working. The calories were counted, the training was consistent, and the result did not follow. Three common causes sit outside anything a formula can see.
- Thyroid function. Hypothyroidism lowers resting energy expenditure and causes weight gain, and it is diagnosed on a panel rather than inferred from a stalled cut.7
- Testosterone. Low testosterone shifts body composition toward fat mass and away from lean mass at the same calorie intake, and treating it in men with confirmed hypogonadism moves both in the other direction.8 Our TRT protocol page covers what that involves, and where to get your testosterone tested covers how to get the number in the first place.
- Sleep. Short sleep raises ghrelin, lowers leptin, and increases appetite, which changes adherence rather than metabolism.9
The pattern across your markers matters more than any single one, because a lone value outside a reference range is only a data point. Three related markers moving together is a pattern, and a protocol should be built on the pattern.
Frequently asked questions
They apply published equations correctly. The equations themselves are population estimates that carry meaningful error for any individual, which is why each tool shows its working and why the guidance is to adjust against your own results.
No. All four run on measurements you can take at home, though the FFMI calculator is much more useful with a body-fat percentage from a DEXA scan than from a bathroom scale.
No. They compute numbers from formulas and do not interpret them for your situation. If you have kidney disease, heart failure, liver disease, or you are on medication that affects fluid balance, follow the targets your physician gave you rather than these.
The FFMI calculator, because it establishes what your weight is actually made of. Everything else is easier to interpret once you know that.
Get the numbers a calculator cannot give you
Every calculator on this page works from measurements you can take yourself. The numbers you cannot take yourself are the ones in your blood, and those are the ones that explain why an accurate plan sometimes stops working. Opt Health runs the panel and gives you a physician to read it. Become a member.
References
- Frankenfield D, Roth-Yousey L, Compher C. Comparison of predictive equations for resting metabolic rate in healthy nonobese and obese adults: a systematic review. J Am Diet Assoc. 2005;105(5):775-789.
- Jäger R, Kerksick CM, Campbell BI, et al. International Society of Sports Nutrition position stand: protein and exercise. J Int Soc Sports Nutr. 2017;14:20.
- Helms ER, Zinn C, Rowlands DS, Brown SR. A systematic review of dietary protein during caloric restriction in resistance trained lean athletes: a case for higher intakes. Int J Sport Nutr Exerc Metab. 2014;24(2):127-138.
- Kouri EM, Pope HG Jr, Katz DL, Oliva P. Fat-free mass index in users and nonusers of anabolic-androgenic steroids. Clin J Sport Med. 1995;5(4):223-228.
- Institute of Medicine. Dietary Reference Intakes for Water, Potassium, Sodium, Chloride, and Sulfate. Washington, DC: National Academies Press; 2005.
- Achamrah N, Colange G, Delay J, et al. Comparison of body composition assessment by DXA and BIA according to the body mass index. PLoS One. 2018;13(7):e0200465.
- Jonklaas J, Bianco AC, Bauer AJ, et al. Guidelines for the treatment of hypothyroidism. Thyroid. 2014;24(12):1670-1751.
- Corona G, Giagulli VA, Maseroli E, et al. Testosterone supplementation and body composition: results from a meta-analysis of observational studies. J Endocrinol Invest. 2016;39(9):967-981.
- Spiegel K, Tasali E, Penev P, Van Cauter E. Sleep curtailment in healthy young men is associated with decreased leptin levels, elevated ghrelin levels, and increased hunger and appetite. Ann Intern Med. 2004;141(11):846-850.
You might also like
Start Today
Your health, your terms. Discover how personalized care can transform not just the way you feel, but how you live.